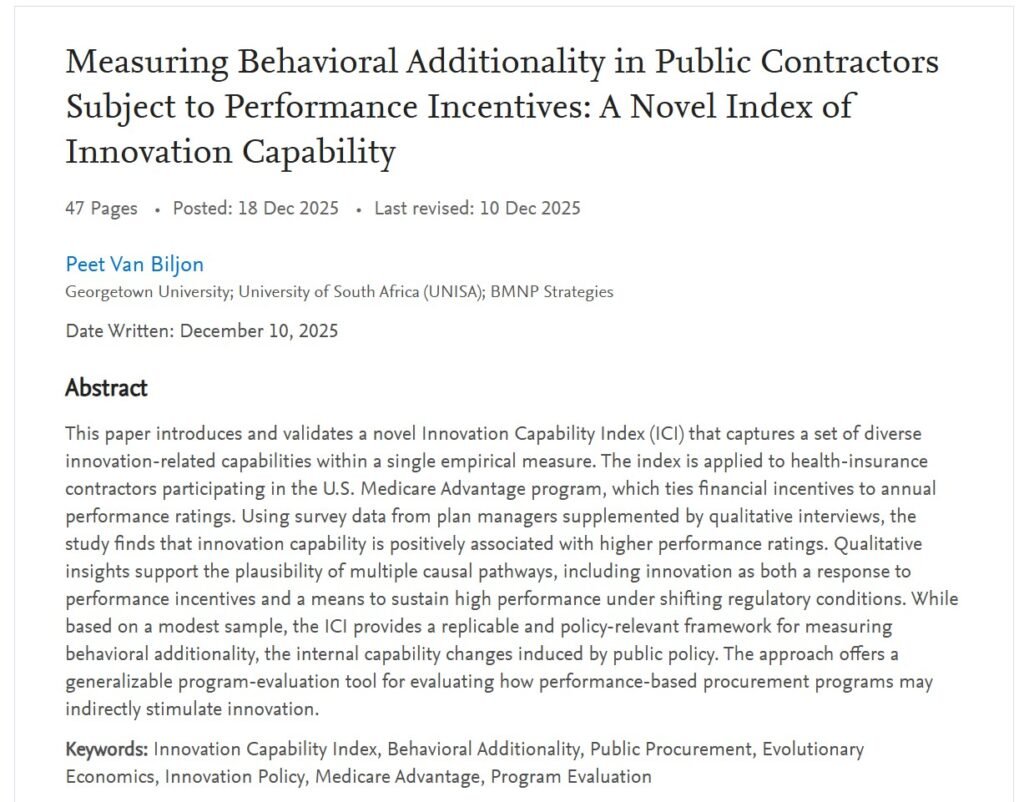
This preprint paper is based on my doctoral research. Please read the Abstract below for details.
SSRN Page
Graphical Abstract
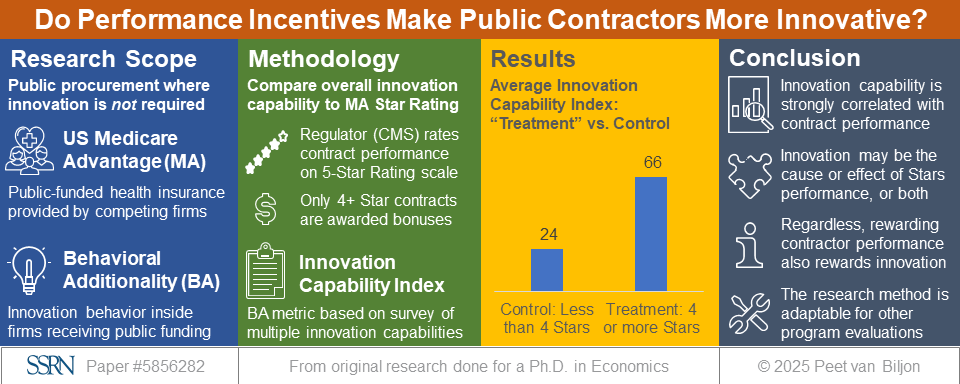
The Graphical Abstract above summarizes the research.
This preprint paper is based on my doctoral research. Please read the Abstract below for details.
The Graphical Abstract above summarizes the research.
I shared a five-part series on LinkedIn on how AI can enhance the entire innovation lifecycle, from identifying opportunities through scaling solutions. This post brings all five installments together in one easy reference.

AI is no longer just an efficiency tool; it is becoming a strategic partner that expands creativity, clarity, and speed in innovation work. Used well, AI sharpens human judgment rather than replacing it.
Key theme: AI supports opportunity discovery, problem framing, concept development, prioritization, and scaling.
Most innovation failures begin with solving the wrong problem.
AI can deepen problem understanding by synthesizing diverse signals, revealing structural constraints, and reframing challenges from multiple stakeholder perspectives.
Example prompts included stakeholder reframing, root-cause analysis, and trend scanning.
The goal is not more ideas—it is better ones.
AI helps generate structured, strategically aligned concepts and convert abstract ideas into tangible prototypes or service concepts.
Prompts focused on structured ideation, constraint-guided creativity, concept variants, and cross-industry analogy.
If everything looks promising, nothing is truly a priority.
AI enables transparent portfolio evaluation by applying consistent criteria such as strategic fit, ROI potential, feasibility, and adoption risk.
Example prompts included prioritization matrices, scenario testing, and risk assessment.
Innovation only creates value when people adopt it.
AI helps design pilot learning loops, customize stakeholder messaging, and track early adoption signals—turning rollout into a disciplined, data-informed process.
Prompts covered pilot design, stakeholder engagement planning, friction analysis, and post-launch learning.
AI-augmented innovation is not about replacing human creativity or leadership—it is about multiplying both.
Across discovery, ideation, evaluation, and launch, AI becomes a powerful accelerator when used deliberately and responsibly.
The 2025 Nobel Prize in Economic Sciences honors Joel Mokyr, Philippe Aghion, and Peter Howitt for illuminating how innovation fuels long-term economic growth — and their insights could not be more relevant to today’s leaders navigating rapid technological change.
Innovation is not only about new products; it’s about building the conditions for adaptability and progress. Mokyr reminds us that progress thrives where knowledge and practice meet — in organizations and cultures that learn continuously. Aghion and Howitt’s theory of creative destruction shows that growth depends on renewal, not protection of the status quo.
Our continued prosperity as a society depends on productivity-driven growth, not just capital accumulation. As new technologies like AI reshape the economy, entrepreneurs and companies must constantly reimagine how they organize, collaborate, and innovate to harness these powerful tools.
It always takes some time for societies to realize the full benefits of transformative technologies — but those who adapt faster become the leaders of their industries.
As an innovation practitioner, I am thrilled to see the Nobel Committee once again celebrate the central role of innovation in economic progress — from Robert Solow (1987) to Paul Romer (2018), and now Mokyr, Aghion, and Howitt (2025).
On a personal note: having conducted my doctoral research in Economics on innovation behavior under performance incentives, I’m especially delighted to see the field of innovation economics receive such well-deserved recognition.
https://www.nobelprize.org/prizes/economic-sciences/2025/popular-information
BY PEET VAN BILJON

Today’s business environment is anything but stable. Shifting trade, energy, and industrial policies. The AI revolution. Changing customer expectations. Fast-moving competitors. These aren’t isolated trends – they’re converging forces reshaping entire industries.
Executives and boards increasingly talk about resilience and adaptability. But what really makes an organization adaptable?
An unanticipated insight from my doctoral research: Innovation and adaptability rely on the same core capabilities.
Organizations that performed well under constantly shifting regulatory and market conditions consistently scored higher on my Innovation Capability Index.
This shouldn’t be surprising. Schumpeter described innovation as the engine of evolution in the economy: a process of creative destruction where new concepts replace the old, and only the fittest organizations survive.
Modern evolutionary economics builds on this thinking, emphasizing dynamic capabilities – the ability to reconfigure products, operations, markets, and even business models – as central to business success.
So, what does that look like in practice?
Think about your organization:
– Are you actively scanning for emerging technologies and shifting customer needs?
– Are you monitoring market signals?
– Do you have a strong process for developing new products and services?
– Are you able to rapidly update existing products in response to opportunities or threats?
– Can you experiment and test quickly, and then scale what works?
– Do your teams collaborate effectively across functions and with external partners?
– Are you placing smart bets on technologies and trends?
– Do you invest in a balanced set of initiatives, and can you rebalance that when needed?
These are key innovation capabilities. But they also make you adaptable.
Just like people take up kickboxing or martial arts not to fight but to build full-body fitness, organizations can build innovation capabilities to enhance overall agility and resilience.
That’s where I come in. I help leadership teams assess where they are today and craft tailored innovation capability programs that improve adaptability; and often lead to new innovations in the process.
Let’s talk if you want to future-proof your organization by strengthening the capabilities that drive both innovation and adaptability.
Contact me to start a conversation.
BY PEET VAN BILJON

In uncertain times, the R&D portfolio is vulnerable to budget cuts. Tying each R&D project to a Business Impact that is justifiable at the Board level protects the R&D portfolio from capricious budgets cuts and provides a rationale for reallocating R&D resources when priorities change.
CTOs are often frustrated when asked to justify an R&D project based on its Net Present Value (NPV) or Return on Investment (ROI). Calculating these values for R&D projects are not feasible other than for late-state development projects that are close to market launch. A real danger of using NPV or ROI thresholds to determine which R&D projects make the cut is that early-stage research projects – for which NPV and ROI are impossible to calculate – will be disadvantaged relative to late-stage development projects. This may or may not be a desirable outcome in a particular strategic scenario, but such a bias risks leaving the portfolio empty of potentially important research needed to fuel the next business growth phase.
The fundamental problem with using NPV and ROI measures for R&D evaluation is twofold: First, they attempt to quantify into monetary units outcomes that cannot yet be so quantified; Second, they intentionally collapse the time and money dimensions into a single measure (respectively time-discounted dollars or percentage return) intended to also reflect the time value of money.
While “What is the NPV or ROI?” is the wrong question to ask for an R&D project, the intent behind the question is entirely legitimate, which is to gauge whether the R&D will add real value to the business. A better question is therefore how the R&D will impact key areas of the business. Reframing the conversation to be about the expected Business Impact, which is the contribution of R&D to important business outcomes, will facilitate more productive discussions between the CTO, the CEO and other executives, and the Board.
The goal of R&D portfolio management is to ensure that limited financial and human resources are deployed in service of the corporate strategy. The composition of the R&D portfolio is the ultimate responsibility of the CTO while the corporate strategy is the responsibility of the CEO, acting in concert with the Board. Considering the potential Business Impact of any R&D project or project proposal creates a built-in mechanism to align the R&D portfolio with the corporate strategy, and by implication to adjust the R&D portfolio as needed when the corporate strategy changes.
There are at least three major dimensions according to which each project in the R&D portfolio should be classified. I call this creating a 3D-Portfolio of R&D Projects. The three essential dimensions are
Other dimensions or considerations may be added, such as the type of technology (technology family or generation), the level of maturity of the technology (though this will be highly correlated with the time horizon in most cases), or the extent to which an R&D project departs from current technology (incremental or radical change).
A sound R&D portfolio-management process will require making design decisions about each of these three dimensions, and then designing the process flows by means of which projects will be added to or removed from the portfolio. Typically, there will need to be a cyclical process (such as the annual budget cycle) and an exception-based process for when portfolio adjustments need to be made inflight.
The sections that follow provide guidance on designing the three dimensions, followed by a very brief discussion of designing the supporting portfolio management processes, as such processes will always be highly specific to any company or organization.
What is a suitable Business Impact to associate with an R&D project? A Business Impact must be more specific than “increasing revenue” or “lowering costs” or “making operations more sustainable.” However, it is the highest-level answer as to how specifically R&D can contribute to such top-level corporate goals. As such, each Business Impact is a vital link connecting desired R&D outcomes to corporate strategic goals.
Business Impact areas can be divided into three categories: those that are revenue-related, those that are cost-related, and a third category covering other areas such as sustainability-, safety-, or regulatory-related Business Impacts. It is advisable to employ a set of Business Impacts that includes at least one selected from each of these three categories.
While business objectives are best phrased at a high level, they also require sufficient specificity. This suggests looking to typical industry metrics or key performance indicators (KPIs) for inspiration. For example, a retail store chain may have the revenue goal “to increase sales per square foot” rather than simply to increase total revenue. An automotive OEM may have the cost-related goal of reducing “warranty cost per vehicle.” A chemicals company may have a KPI related to regulatory or environmental compliance, specified in terms of minimizing the “number of regulatory violations”.
Each industry has such KPIs with which everyone will be familiar. Table 1 contains examples for typical industries but is far from exhaustive. It is best to select about four or five such Business Impact areas in total for classifying your company’s R&D projects. If these have already been spelled out in a Board directive to the executive you are lucky, but absent that it is usually not hard to pick an uncontroversial set of business outcomes that R&D can impact and which few would disagree with.
The beauty of being able to classify each R&D project by the Business Impact dimension is that it makes it easy to answer questions from the Board such as “How much of our $50 million R&D spending is going to greenhouse gas (GHG) reduction?” In this example, if GHG reduction were one of your Business Impact areas (as it should be if it’s important for your company and in your industry), you would have the subtotal of R&D spending on that Business Impact readily available.
When the corporate strategy then needs to be adjusted due to say economic headwinds, the conversation can be about how to shift the balance of the R&D portfolio between Business Impacts. For example, the current R&D portfolio may be 30 percent allocated to a cost-related KPI such as “overhead ratio” in financial services. If a banking crisis causes the Board to demand a greater emphasis on such projects, it would mean shifting the balance to say 50 percent of the total R&D portfolio. Such a change may be achieved by increasing the number of projects related to that impact area, or reducing other projects, or by a combination of both actions.
Table 1. Examples of Industry KPIs Associated with Business Impact (Illustrative, Not Exhaustive)
| Industry | Revenue-related (topline) | Cost-related (bottom line) | Other metrics |
| Automotive | Market share | Warranty cost | Fuel efficiency; platform commonality |
| Chemicals | Plant utilization | Energy usage per production unit | Number of regulatory violations; environmental compliance |
| Consumer packaged goods | Average consumer spending (on company products) | Supply chain efficiency | Brand loyalty; percent of ethically sourced products |
| Financial services | Assets under management | Overhead ratio | Risk-weighted assets; Basel III ratios |
| Manufacturing | Capacity utilization rate | Scrap rate | Backorder rate; changeover time |
| Metals & mining | Production volume | Cost per ton | Water quality index; safety |
| Oil & gas | Break-even oil price | Lifting costs | Exploration success rate; carbon intensity |
| Pharmaceuticals | Percentage of revenue from blockbuster drugs | Cost per new drug development | Pipeline strength; number of clinical trial failures |
| Retail | Sales per square foot | Cost per square foot | Average discount depth; customer satisfaction score (CSAT) |
| Technology | License and subscription renewal rates | Cost per line of code | Platform uptime; data breach incidents |
How do you prioritize R&D proposals that are tied to different Business Impact areas? Moving away from a single metric such as NPV or ROI to compare a R&D project’s value-add to multiple Business Impacts means that you have to find a way of comparing apples with oranges. However, this is not as hard to do as it may seem but it does require a shift in mindset:
The common scale of comparison for all Business Impacts becomes an ordinal scale with three to four intuitive impact descriptions on it, such as Low, Moderate, High, and Very High. The design work is in defining what each impact description means for each Business Impact area. For example, if the Business Impact is reflected by a KPI that can typically only be moved in single digit percentages, it would look like the “Business Impact 1 KPI” in Table 2, where a “High” impact is classified as a 5 to 10 percent increase. Another Business Impact may be easier to inflect, such as “Business Impact 2 KPI”, and therefore may need to be improved by 20 to 30 percent for it to be considered a “High” impact.
Completing such a table for each Business Impact area versus the ordinal scale for the impact (e.g., low to very high) will result in an impact “rubric” which can be used to compare the potential relative benefit or value-add for R&D projects that are entirely different in kind, for example, an increase in market share versus engine fuel efficiency for an automobile OEM.
Table 2. Illustrative Rubric for Comparing Business Impact
| Business Impact 1 KPI | Business Impact 2 KPI | |
| Low | < 1% | < 10% |
| Moderate | 1 to 5% | 10 to 20% |
| High | 5 to 10% | 20 to 30% |
| Very high | > 10% | > 30% |
Before launching the new rubric to grade the first R&D project proposals, the CTO’s team must take great care in calibrating the scales with the involvement of the entire R&D leadership and key stakeholders in other departments. That will create trust and prevent anyone from gaming the system to advance their pet projects.
It is also important to be fair and maintain the integrity of the grading for each R&D project by using peer review to check the claimed magnitude of the Business Impact KPI movement for each case under consideration. This is best done in an R&D budget decision meeting with all the major parties present.
A multi-year classification framework is needed to indicate the approximate timeframe in which an R&D project’s Business Impact is expected to be achieved. The simplest and most intuitive approach is to use the Three Horizons, where Horizon 1 (H1) is the short term, Horizon 2 (H2) is the medium term, and Horizon 3 (H3) is the long term. For illustrative purposes, H1 is typically 12 to 18 months, H2 is 18 months to 3 or 4 years, and H3 is farther out. However, the durations will differ by industry as industries have shorter or longer cycle times. You’ll need to define the Time Horizons that make sense for your industry and apply them consistently.
The Time Horizons will facilitate the cross-referencing of the 3D R&D portfolio with your company’s Technology Strategy. For example, where your strategy is to only implement fairly mature technologies in a particular technology domain, that may result in only selecting R&D projects in that domain that fall within H1. On the other hand, if you see yourself as a technology leader in your industry for a particular domain, that would argue for having R&D projects all the way out into H3.
By far the best way to have a portfolio of R&D projects that can each be tied to Business Impact is to create it that way from the start. This can be done by employing the portfolio framework described above.
Rather than simply inviting and collecting R&D proposals or ideas – as is often the case during the annual proposal cycle – you must give guidance on what types of proposals are desired and how they will be evaluated. You should map out the portfolio composition you want to end up with by constructing a table indicating desired allocations (percentages or dollars) by Business Impact versus Time Horizon. This guidance should be compiled ahead of the proposal invitation period by the CTO’s team in consultation with key business partners and with reference to the corporate strategic objectives for the year.
Following this process will effectively cascade the corporate strategic goals down to high-level R&D departmental goals and shape the resulting new R&D portfolio. [I previously described the complete hierarchy of innovation value-creation levels versus the parts of the organization responsible for each step in Chapter 7 of my book, Innovation for Value and Mission – An Introduction to Innovation Management and Policy.]
Once you have defined your 3D framework, you can use it to retroactively classify and organize all existing R&D projects. This may be necessary in case of a mid-cycle event such as receiving a new strategic directive from the Board or CEO that necessitates a rebalancing of the R&D portfolio. Having an R&D portfolio classified by the three dimensions will facilitate the most rational and unbiased way of making portfolio changes, even if there has to be cuts. And it will minimize the likelihood of making cuts that you’ll deeply regret later!
This article was originally posted by the author on LinkedIn.
©2025 Peet van Biljon. All rights reserved.
Thank you for a great conversation, Rex Wallace, Mick Twomey and Nate Lucena!
There is indeed a real opportunity to improve Star Ratings with innovation. Special thanks to all the Star managers who participated in my research and to the Medicare Advantage experts who helped me better understand the context in which managers make decisions.
Watch Part 1:
Rising Stars podcast S3 E4
Watch Part 2:
Rising Stars podcast S3 E6
BY PEET VAN BILJON

The creativity needed to come up with innovative new ideas relies on novel connections being made in our brains, and on people having the courage to share their ideas with others. Think of it as depending two types of connections: first within the individual brain, and second between many brains within the organization and even beyond organizational boundaries. Both types of connection can be surprisingly hard to make in the face of individual and organizational challenges. Understanding how the human brain handles creativity will help you to overcome these challenges.
The following is an extract from Chapter 4 of my book, Innovation for Value and Mission – An Introduction to Innovation Management and Policy, published by De Gruyter Brill.
Creativity in business has been much in vogue the last couple of decades. No doubt it is partly influenced by the ascendancy and prevalence of the design-thinking movement since the turn of the century, and the importance which creativity has in that process. But it is perhaps also because there is a belief that human creativity is now better understood and, therefore, can be more easily marshalled. Advances in neuroscience, largely enabled by new brain-imaging technology and accompanying popular media articles touting insights into the workings of the brain, have put creativity on the business agenda. Almost every month, the Harvard Business Review publishes some piece that has creativity in the title or subtitle. Some of the neurological-research insights (Waytz and Mason, 2013) that have made their way into the management lexicon are:
Creativity in business has been much in vogue the last couple of decades. No doubt it is partly influenced by the ascendancy and prevalence of the design-thinking movement since the turn of the century, and the importance which creativity has in that process. But it is perhaps also because there is a belief that human creativity is now better understood and, therefore, can be more easily marshalled. Advances in neuroscience, largely enabled by new brain-imaging technology and accompanying popular media articles touting insights into the workings of the brain, have put creativity on the business agenda. Almost every month, the Harvard Business Review publishes some piece that has creativity in the title or subtitle. Some of the neurological-research insights (Waytz and Mason, 2013) that have made their way into the management lexicon are:
The value of unfocused free time for coming up with breakthrough insights. For example, Google reportedly allows engineers to work 20 percent of their time on anything they want.
The effectiveness of nonfinancial incentives and rewards, such as praise and recognition, and intrinsically interesting work in stimulating innovation.
The potential usefulness of hunches and emotional impulses in decision-making, which makes them worth exploring instead of outright dismissing them as subjective.
The importance of focusing on one task at hand rather than multitasking (juggling multiple activities and objectives).
Much lip service is paid to the importance of creativity in business. Creativity is, of course, an important element of innovation, and the business media love to feature stories about creativity and innovation. But in reality, there is a deep built-in reluctance in organizations to be truly creative and innovative. Indeed, we have all experienced how people can resist creative and novel ideas. Most of us have likely done it ourselves when we said, “That is a good idea, but here is why it won’t work.”
Despite the value that people seem to attach to creativity, they also have a paradoxical tendency to reject creative ideas. Research has shown that people associate creativity and novelty with uncertainty, and that a negative bias against creativity occurs when uncertainty is perceived, interfering with their ability to properly judge the creative idea offered (Mueller, Melwani, and Goncalo, 2012). In addition, people also implicitly associate what is proven with what is practical. If something has already been done, it is considered practical. If something has never been done, it is considered impractical. These two associations – creativity with uncertainty and unproven with impractical – together explain why new ideas are often rejected. Managers who would like to encourage creativity need to find ways of helping their team members to cope with the anxieties associated with uncertainty and doing things in new ways.
In the last decade, there were close to a thousand published studies on the neuroscience of creativity. Such studies typically rely on accessing the creative task performance of test subjects by means of brain imaging technologies such as functional magnetic resonance imaging (fMRI) and electroencephalography (EEG). These imaging technologies still impose major experimental constraints – for example, requiring subjects to lie down while they think creative thoughts. Nevertheless, these have proven to be powerful tools and neuroscience researchers have gained a deeper understanding of what it takes to put the brain into a creative mode for the purposes of innovating as neuroscience researchers. Neuroscientists Andreas Fink and Mathias Benedek (2019) explain the mental process of innovation as follows: “For example, envisioning possible improvements to products, requires memory processes to build novel representations of these products, sustained internally-oriented attention to guide active imagination, and vigorous executive control to realize effective and useful task solutions by evaluating/elaborating preliminary thinking results, and by inhibiting prepotent/conventional responses.” (Fink and Benedek 2019, 3)
In simple terms, this means that would-be innovators can get more creative about their product offerings if they frame these offerings in new and different ways, employ techniques that guide their creative thinking, and constantly guard against jumping to conventional solutions.
An important insight about the human brain is that it often optimizes for efficiency, which in many instances is the enemy of creativity. The human brain comprises only about 2 percent of body weight but uses 20 percent of energy consumed while the body is at rest. Researchers estimate that the human brain has about 86 billion neurons. For comparison, a cat’s brain has only 250 million neurons and a chimpanzee, 7 billion (Cherry, 2020). Regardless of its exact number of neurons, the human brain is clearly a marvelous organ capable of outstanding intellectual feats at higher efficiencies than any current computer can approach. But even so, it is subject to constraints imposed by its size and energy-consumption budget.
About two thirds of the brain’s energy is used to help neurons (or nerve cells) fire or send signals; the remaining third is used for housekeeping (Swaminathan, 2008). In its attempt to avoid wasteful thinking that consumes unnecessary energy, the brain takes shortcuts and makes assumptions all the time. An eerie insight from contemporary neuroscience is that what we perceive as our conscious reality is actually a type of elaborate virtual-reality simulation (some call it a “controlled hallucination”) constructed by our brains. Perception is a series of guesses by the brain, a reconstruction of reality. Put another way, perception is not a window on reality as it is, but more like a 3D desktop on a computer that is designed to hide the complexity of the real world and guide our adaptive behavior (Seth, 2021). We literally live our entire lives in a virtual reality created by our brains. If the brain gets it more or less right, this virtual reality is useful to us. If it doesn’t, we can make surprisingly big errors in judgement. Stage magicians have always understood this instinctively, which is how they manage to trick their audience by distracting them and making the audience “see” only what the magician wants them to see.
The more you know about a topic, the more your brain’s efficiency will become a barrier to seeing things differently. Experts can be the most intransigent and resistant to innovation because they have such strongly formed and well-practiced constructions of what they believe to be the correct reality. Experts feel that they have “seen it all before” and tend to think they already know the answers. They are also fond of conventions – well-established ways of doing things – because their conventions have served them well across their careers: “It’s just the way we do things.” Shortcuts are closely related – they are quicker and more efficient ways of doing things that people have done before, typically many times. Shortcuts are efficient, and therefore useful. However, when people take shortcuts, they are not fully applying their minds.
Young children are more disposed to creativity than most adults. As we further our education, we are trained well in asking the “What,” “Why,” and “How” questions. But we stop asking one question that young children ask all the time: “What If?” For example, “What if I could fly?”, “What if I could make myself invisible?” or “What if my dog/cat/teddy bear could talk?” “What If” questions have the marvelous ability to transport us from the familiar world of what is to the unfamiliar world of what could be. For adults to become creative again, they need to revive their childlike ability to ask “What If” questions.
In order to get well-trained brains out of conventional mode and into creative, innovative mode, they need to be jolted. Such jolts come in a couple of categories, but they both involve perception – what people perceive. Changing perspective to look at the same things in new and different ways is one way to jolt the brain out of the rut it is in. Techniques include leaving the office to spend a day in the customer’s shoes. Another way to jolt the brain is to present it with a strong dose of new information – strong in the sense of almost overwhelming it. That is why it is said the travel broadens the mind. Indeed, going on a trip to a place where things are done to different rules can deliver an inspirational jolt to the brain.
Coming up with creative ideas is only one half of the battle. The other half is to overcome the organizational resistance that creative ideas encounter all too often and that kills them in their infancy. While people like to think of themselves as open-minded and welcoming of creativity, they often resist creative ideas when these are actually presented to them. This bias against creativity has been confirmed in psychological studies and shown to be closely associated with the human desire to reduce uncertainty (Mueller, Melwani, and Goncalo, 2012). The bias against creativity is not overt, which makes it tricky to address. It lurks in the background, interfering with our ability to recognize the value of a creative idea.
Much of our resistance comes from our inability to see novel ideas as practical – we have a strong association between proven and practical and conversely, a strong association between novel and impractical. Indeed, innovators are often told by naysayers that while their idea is certainly novel and deserves to be applauded for its originality, it is unfortunately not practical and cannot be implemented successfully.
There is a social norm that requires us to value creativity, so people hide their opposition to creative ideas. They cloak their objections in other terms; with concerns about the lack of practicality of the novel solution being the most frequent tactic. This poses a great contradiction: Organizations say they want creative solutions, but frequently reject creative ideas when they are presented. Innovators need to pay just as much attention to getting organizational buy-in for their ideas as coming up with the ideas in the first place.
The good news is that any individual, or any team, can be creative. It does not require special talent or innate abilities. Fairly simple techniques can unleash creativity in people at all levels of seniority, from the most senior executives to entry-level workers. In order to unleash the creativity of a team, people first need to be given permission to be creative. That may require a special occasion and a safe space, as well as an introductory talk by a senior leader telling them that the organization needs their creativity to solve real and valuable problems. Then, people need to be taught and walked through some creative exercises, ideally by a facilitator who has experience with the exercises and can help keep the session on track when people get stuck or veer off on a tangent, which will inevitably happen.
There are an almost infinite variety of creativity techniques, some more suitable for some types of problems and situations than others. In the next section of Chapter 4 of Innovation for Value and Mission, a few types of proven techniques are introduced and the principles behind them explained. The creativity techniques discussed include overthrowing orthodoxies, constructing analogies, thinking like the customer, and imposing constraints.
As with anything new and worth doing, the best way is to avoid analysis-paralysis and just make a start: Try something on a small scale, learn from the experience, and keep building your individual and organizational muscles so that you get stronger and better at creativity and innovation all the time. Anyone can be creative (again), it simply requires relearning what you could do when you were four years old!
This article was originally posted by the author on LinkedIn.
©2025 Peet van Biljon. All rights reserved.
As of this morning, it’s the No.1 New Release in the Amazon book category ‘State and Local Government’.

BY PEET VAN BILJON

The CHIPS and Science Act of 2022 injects $280 billion into U.S. research, innovation, and manufacturing over the next five years. The “CHIPS” name reflects the priority given to the semiconductor industry with $52.7 billion of dedicated semiconductor spending, including $39 billion in grants and a 25% tax credit for on-shore US manufacturing. The policy goal is to increase the U.S. manufacturing share of this crucial technology after years of decline – from 37 percent in 1990 to 12 percent (relative to the US semiconductor consumption of 34%) – mostly due to more aggressive industry investments by other governments. The Act also reflects the urgency of addressing semiconductor shortages and cyclic dynamics which trouble multiple industries (for example, automotive manufacturing), and impede U.S. economic growth.
Our modern economy runs on semiconductors: both discrete devices such as power transistors and diodes that handle electric power or govern electric motors, and integrated circuits (ICs or “chips”) which are typically manufactured as wafers and contain thousands to billions of devices, mainly transistors. ICs may be microprocessors or memory chips used in computing, or commodity electronic building blocks used in a myriad of circuit designs, as well as custom circuits on a single chip, such as 5G wireless or GPS chips for your smartphone. An exponential growth in chip complexity over the last few decades has enabled our digital age and so much of the functionality we too easily take for granted. The smartphone in your pocket has far more computing power than NASA used for 1969 Apollo moon mission.
The global semiconductor market is forecast to be worth $633 billion in 2022, up 13.9 percent from 2021 of which the U.S. market share is about half. After a period of low profitability in the early 2000s, semiconductor companies have seen their economic profits grow strongly into the double digits since the late 2010s. The industry outlook is strong with no sign of demand abating. This makes some question why large industry subsidies are needed.

Though the CHIPS Act passed with bipartisan majorities in both the Senate and House, most Republicans opposed it. This is in line with a long tradition of skepticism about the U.S. government’s role in shaping and subsidizing industries. Unlike many other developed countries, the United States has generally eschewed an industrial policy of deliberately building up strategic industries. Yet, it also has a long tradition of making exceptions considered to be in the national interest.
The exigencies of World War II forced the U.S. government to be directly involved in weapons development, from basic research to production. The Manhattan Project (nuclear bomb) is the most famous example, but radar and computers were wartime government projects too. In each case, the government partnered with select universities and private firms. After the war, the government initially resolved to limit itself to only funding basic research. But the 1957 Sputnik launch and the military threat posed by the Soviet Union soon changed that, leading to the creation of NASA and DARPA in 1958. Technologies created with defense dollars have subsequently enabled great private-sector innovation, for example the internet and GPS. DARPA maintains partnerships with semiconductor firms for the development of new technologies, often with both military and civilian applications.
What is the public-policy rationale for a $52.7 billion government investment in one industry?
First, there is a substantial U.S. national-security interest, which includes self-sufficiency in advanced devices for defense and aerospace systems. Specifically, China’s territorial claims on Taiwan, which dominates global semiconductor manufacturing, is seen as a national-security risk.
Second, there is a desire to increase industry resilience to global supply-chain disruptions such as happened due to COVID lockdowns. A reliable supply of semiconductors is needed to make anything from home appliances and automobiles to the computers and data centers essential for continued national productivity growth.
Third, there is a global manufacturing capacity shortfall in the industry with factories running at full capacity, but unable to meet demand; backlogs are running at six months or longer.
Fourth, semiconductors are a top 5 U.S. export amounting to $60 billion, and a category in which the United States maintains a trade surplus.
Understanding more about the development and state of the semiconductor industry will provide further context on why the semiconductor industry was considered worthy of an exception to the general avoidance of industrial policy.

Transistors are tiny multilayered devices made from silicon or germanium of which some parts are precisely infused with impurities, enabling them to amplify or switch electrical current. Transistors and other semiconductors are the active components in almost all modern electronics. The transistor was invented by Bell Labs scientists in 1947 and the first integrated circuits (ICs) containing multiple transistors on a single chip appeared in the 1950s. In 1965, Gordon Moore (a future cofounder of Intel) wrote a prescient paper predicting that ICs containing more integrated electronics would revolutionize telecommunications and computing. Moore’s observation that the number of transistors on a single chip were doubling every two years as techniques improve became known as Moore’s Law, and was soon interpreted to mean that computing power would double every two years. In 1965 only 60 transistors fit on one IC, but Moore’s Law meant that by 1975 a state-of-the-art microchip would contain 65,000 transistors, which came to pass in 1975 exactly as predicted. Moore’s Law subsequently set industry expectations and became a self-fulfilling prophesy. By 1989, Intel launched the first 1-million-transistor microprocessor, the 80486. Today, over 2 trillion transistors can be crammed onto a chip. The end of Moore’s Law has been declared many times as miniaturization techniques ran into physical limits, yet ingenuous chip designers keep inventing new techniques to extend it.
The semiconductor node size in nanometers (nm) historically represented the smallest features that could be created by a particular manufacturing process. The node size is an indicator of how many devices one chip can contain (the smaller the node, the more devices) and hence related to Moore’s Law. Node size is also used to indicate the technology generation, with successive generations having smaller node sizes. The current cutting-edge node, 5 nm, is used for chips with the highest transistor densities such as powerful processors for mobile phones and computers. But as nodes advance, manufacturing and design costs escalate. Fabs, as individual factories are called, need new equipment to build different nodes. Building a 7nm or 5nm fab is so expensive that only Intel, TSMC, and Samsung have done so. These firms are now launching 3 nm processes.
However, most chip applications do not require the smallest nodes. Production of chips continue in nodes as large as 130 nm, while 20, 14 and 12 nm nodes can still meet support high-performance applications as process advances continue to be made by companies such as GlobalFoundries. There is a misperception that sub-7nm logic chip technology – still less than 30 percent of the market – is all-important. The United States needs to onshore a much broader set of semiconductor technologies. Such technologies include radio and optical communication chips used in a vast number of products essential for national security and industry resilience. Leading-edge innovation in these technologies depends more on specific device and circuit architectures, and less on node size.
Little is gained if American-made wafers have to shipped offshore to be packaged into devices. Chip packaging – historically a low-margin business – is now a critical technology as 2.5D and 3D architectures are needed for advanced designs. The CHIPS Act accordingly invests in microelectronics packaging technology with the new Advanced Packaging National Manufacturing Institute created by the Act.

The industry is global and interconnected with three main types of semiconductor companies: those who design but do not manufacture are called “fabless” firms; those who only manufacture, usually for multiple design clients, are called foundries; and those who package and test the semiconductors coming out of the foundries. Increasing foundry capacity is costly with a new fab’s construction and operating costs easily being $2 -3 billion; more for the latest technologies. Chipmaking is a highly capital-intensive industry with each node generation demanding a larger expenditure on equipment than the previous. Due to high fixed costs, most chip companies outsource manufacturing to foundries, who achieve high utilization by making chips for multiple customers. AMD, Nvidia, and Qualcomm are all fabless: their chips are manufactured by contract foundries. Intel is one of the few remaining Integrated Device Manufacturers (DMs) – designers with their own foundries – as is Samsung. But even IDMs use contract foundries to make some of their chips.
The majority of semiconductors worldwide, including the most advanced chips with the highest component densities, are made in Taiwan by various foundries including the world’s largest, TSMC, which counts Apple, Qualcomm, Nvidia, and other technology companies among its clients. The next largest manufacturer is Samsung in South Korea.
Both TSMC and Samsung plan to build foundries in the United States: a $12 billion Arizona fab for TSMC, and a $17 billion fab in Texas for Samsung. Intel has started construction of its new $20 billion Arizona fabs and will also build new fabs in Ohio for an initial $20 billion investment which could grow to $100 billion making it the world’s largest chip plant. Several of these investments were contingent on the CHIPs Act passing. And just after the Act was signed by President Biden, Micron announced a $40 billion investment in U.S. memory chip manufacturing.
The CHIPS Act seems to be off to a good start.
All images courtesy of GlobalFoundries.
A different version of this post first appeared on De Gruyter Conversations.
My book, “Innovation for Value and Mission,” is now available in paperback; eBook following shortly.
The eBook can already be bought or accessed through institutional subscriptions at my publisher, De Gruyter, where you can also buy the paperback.
eBook ISBN: 9783110711066
Paperback ISBN: 9783110711035