I’m excited to be teaching Innovation & Public Policy again this fall to graduate students at Georgetown University’s McCourt School of Public Policy.
The course examines innovation from both the organizational and public-policy perspectives. We begin with the nature of technological innovation and its relationship to economic growth and prosperity, then move through creativity and design thinking, innovation in organizations, open innovation, business- and mission-model innovation, innovation management, financing, sustainability and inclusion, and finally the policy tools governments can use to stimulate innovation. The emphasis throughout is on connecting ideas to practice through discussion, exercises, individual analysis, and a public-sector team innovation project.
The course also forms the foundation for my textbook, Innovation for Value and Mission: An Introduction to Innovation Management and Policy, which was directly inspired by the content I developed when I created this course and expands substantially on many of its themes. It is not only a textbook, but a reference for practitioners too – I wrote it for myself and often use it as a desk reference!
One aspect of the course feels particularly timely this year. Student interest in artificial intelligence has risen markedly. That is hardly surprising. AI is no longer simply an emerging technology to be studied at some distance; most of us are using AI daily and it is becoming a major technological disruption unfolding around us in real time.
That creates an unusually rich environment for studying innovation. Students want to understand not only what AI can do, but how it may reshape industries, government, employment, skills, organizations, and society—and what public-policy responses may be appropriate. The course’s technology innovation research assignment explicitly asks students to examine a recent disruptive technology, assess its trajectory and use cases, and consider its implications for both government and commercial operators as well as policy makers and regulators.
For students of innovation and public policy, this is an extraordinary period in which to be asking these questions. The challenge is not merely to anticipate technological change, but to understand how we can continually manage and shape innovation so that it contributes to human welfare and prosperity.
I enjoyed participating in the IEEE TEMSCON Global 2026 conference and meeting so many professionals who share my passion for technology, engineering, and R&D management. TEMSCON Global is the flagship conference of the IEEE Technology and Engineering Management Society (TEMS) and a premier venue for research on management, innovation, and leadership across the spectrum of technology, science, and engineering.
It was fun visiting Montreal again (always best in the summer!) and the conference venue, the École de Technologie Supérieure (ETS), was ideal because this Quebec university is so focused on technological innovation. There were several great plenary sessions and paper presentations from researchers all over the world.
In the runup to the conference, I was happy to help the excellent general co-chairs, Andy Chen and Tariq Samad, by reviewing some submitted papers as a member of the International Program Committee.
On Thursday, I chaired the R&D Management session and also presented a paper, “Aligning the R&D Portfolio with Strategy Using a Method Based on Expected Business Impact”, by me and George Hemingway.
ABSTRACT
R&D project portfolios are commonly constructed by applying multiple criteria and weighted scoring methods not widely understood beyond R&D practitioners. This complicates justifying investments in R&D to the CEO and Board. The limitations of valuing R&D projects in purely financial terms point to a need for expressing R&D project value in alternative terms relatable to business strategy. The proposed method aligns R&D investments directly with various intended contributions to business success called Business Impacts. This judgment-based method crucially includes a technique for directly comparing different types of Business Impacts, thereby creating a non-financial, but common, scale for project valuation that all projects can be ranked on. Agreeing with the CEO and other key stakeholders on the composition of a desired Target Portfolio in terms of Business Impact and Time Horizon prior to R&D proposal solicitation and selection will cascade strategy and improve the quality of R&D proposals. The process is flexible and can be augmented by Technology Strategy elements such as Technology Roadmaps and other criteria. The resulting R&D Portfolio is readily communicable at the Board level and facilitates strategic rebalancing as the need arises.
The paper will eventually be published in the IEEE Transactions but here is the preprint for now.
I was deeply saddened to learn that my coauthor and former pastor, James C Sprouse, passed away last week.
A graduate of the University of Virgina and Union Theological Seminary, Jim served as pastor for over 40 years. He was my pastor for 15 of those years. We found his congregation after moving to McLean from Toronto with a toddler and a baby. He baptized our baby, my younger son.
Ten years ago, I asked Jim to help me write a Christian guide to ethical business leadership by applying ancient biblical teachings to modern business issues. He immediately agreed and I will always be grateful for everything that I learned from him during our collaboration, which is captured in the book, Profit with a Higher Purpose.
Jim now rests in the presence of Christ, whom he served his whole life. My prayers and condolences are with his family.
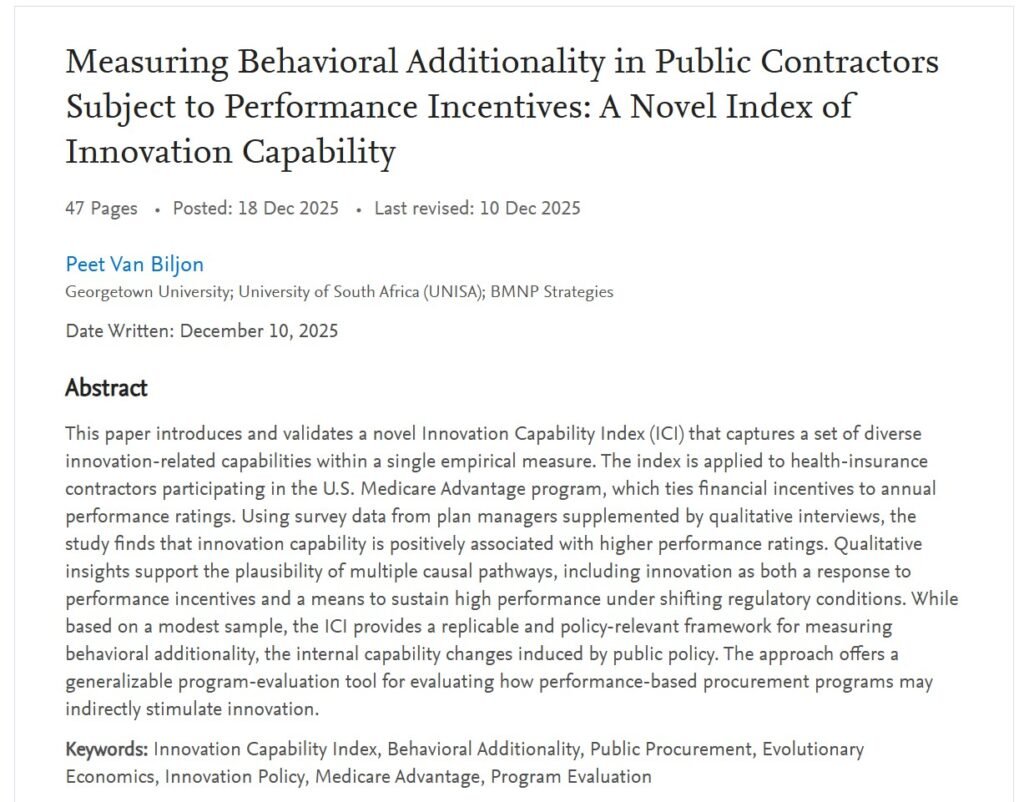
Delighted to share that my article introducing a method for measuring innovation capabilities in public contractors has been published in Science and Public Policy (special open-access link below). The article is based on my doctoral research.
It details the development of an Innovation Capability Index (ICI) that captures a set of diverse innovation-related capabilities within a single empirical measure. The ICI is a new tool for measuring what is called behavioral additionality, i.e. internal innovation capability changes in private companies induced by public policy.
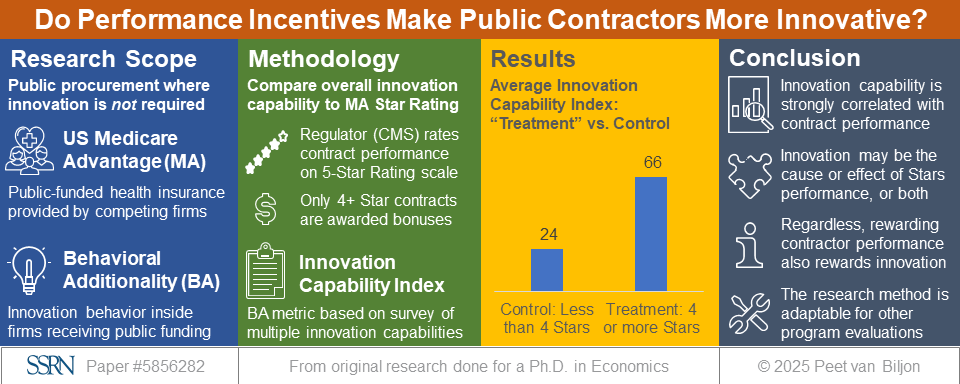
The ICI was applied to health-insurance contractors participating in the U.S. Medicare Advantage program, which ties financial incentives to annual performance ratings. It was found that innovation capability is positively associated with higher performance ratings, which may be due to multiple causal pathways.
The approach offers a generalizable program-evaluation tool for evaluating how performance-based procurement programs may indirectly stimulate contractor innovation.
I shared a five-part series on LinkedIn on how AI can enhance the entire innovation lifecycle, from identifying opportunities through scaling solutions. This post brings all five installments together in one easy reference.
1. The Shift — AI as a Strategic Innovation Partner
AI is no longer just an efficiency tool; it is becoming a strategic partner that expands creativity, clarity, and speed in innovation work. Used well, AI sharpens human judgment rather than replacing it.
Key theme: AI supports opportunity discovery, problem framing, concept development, prioritization, and scaling.
2. Discovery & Problem Definition
Most innovation failures begin with solving the wrong problem.
AI can deepen problem understanding by synthesizing diverse signals, revealing structural constraints, and reframing challenges from multiple stakeholder perspectives.
Example prompts included stakeholder reframing, root-cause analysis, and trend scanning.
3. Ideation & Concept Development
The goal is not more ideas—it is better ones.
AI helps generate structured, strategically aligned concepts and convert abstract ideas into tangible prototypes or service concepts.
Prompts focused on structured ideation, constraint-guided creativity, concept variants, and cross-industry analogy.
4. Evaluation & Prioritization
If everything looks promising, nothing is truly a priority.
AI enables transparent portfolio evaluation by applying consistent criteria such as strategic fit, ROI potential, feasibility, and adoption risk.
Example prompts included prioritization matrices, scenario testing, and risk assessment.
5. Launch & Scaling
Innovation only creates value when people adopt it.
AI helps design pilot learning loops, customize stakeholder messaging, and track early adoption signals—turning rollout into a disciplined, data-informed process.
Prompts covered pilot design, stakeholder engagement planning, friction analysis, and post-launch learning.
AI-augmented innovation is not about replacing human creativity or leadership—it is about multiplying both.
Across discovery, ideation, evaluation, and launch, AI becomes a powerful accelerator when used deliberately and responsibly.
The 2025 Nobel Prize in Economic Sciences honors Joel Mokyr, Philippe Aghion, and Peter Howitt for illuminating how innovation fuels long-term economic growth — and their insights could not be more relevant to today’s leaders navigating rapid technological change.
Innovation is not only about new products; it’s about building the conditions for adaptability and progress. Mokyr reminds us that progress thrives where knowledge and practice meet — in organizations and cultures that learn continuously. Aghion and Howitt’s theory of creative destruction shows that growth depends on renewal, not protection of the status quo.
Our continued prosperity as a society depends on productivity-driven growth, not just capital accumulation. As new technologies like AI reshape the economy, entrepreneurs and companies must constantly reimagine how they organize, collaborate, and innovate to harness these powerful tools. It always takes some time for societies to realize the full benefits of transformative technologies — but those who adapt faster become the leaders of their industries.
As an innovation practitioner, I am thrilled to see the Nobel Committee once again celebrate the central role of innovation in economic progress — from Robert Solow (1987) to Paul Romer (2018), and now Mokyr, Aghion, and Howitt (2025).
On a personal note: having conducted my doctoral research in Economics on innovation behavior under performance incentives, I’m especially delighted to see the field of innovation economics receive such well-deserved recognition.
Today’s business environment is anything but stable. Shifting trade, energy, and industrial policies. The AI revolution. Changing customer expectations. Fast-moving competitors. These aren’t isolated trends – they’re converging forces reshaping entire industries.
Executives and boards increasingly talk about resilience and adaptability. But what really makes an organization adaptable?
An unanticipated insight from my doctoral research: Innovation and adaptability rely on the same core capabilities.
Organizations that performed well under constantly shifting regulatory and market conditions consistently scored higher on my Innovation Capability Index.
This shouldn’t be surprising. Schumpeter described innovation as the engine of evolution in the economy: a process of creative destruction where new concepts replace the old, and only the fittest organizations survive.
Modern evolutionary economics builds on this thinking, emphasizing dynamic capabilities – the ability to reconfigure products, operations, markets, and even business models – as central to business success.
So, what does that look like in practice?
Think about your organization:
– Are you actively scanning for emerging technologies and shifting customer needs? – Are you monitoring market signals? – Do you have a strong process for developing new products and services? – Are you able to rapidly update existing products in response to opportunities or threats? – Can you experiment and test quickly, and then scale what works? – Do your teams collaborate effectively across functions and with external partners? – Are you placing smart bets on technologies and trends? – Do you invest in a balanced set of initiatives, and can you rebalance that when needed?
These are key innovation capabilities. But they also make you adaptable.
Just like people take up kickboxing or martial arts not to fight but to build full-body fitness, organizations can build innovation capabilities to enhance overall agility and resilience.
That’s where I come in. I help leadership teams assess where they are today and craft tailored innovation capability programs that improve adaptability; and often lead to new innovations in the process.
Let’s talk if you want to future-proof your organization by strengthening the capabilities that drive both innovation and adaptability.
In uncertain times, the R&D portfolio is vulnerable to budget cuts. Tying each R&D project to a Business Impact that is justifiable at the Board level protects the R&D portfolio from capricious budgets cuts and provides a rationale for reallocating R&D resources when priorities change.
Why CTOs (Rightly) Hate NPVs
CTOs are often frustrated when asked to justify an R&D project based on its Net Present Value (NPV) or Return on Investment (ROI). Calculating these values for R&D projects are not feasible other than for late-state development projects that are close to market launch. A real danger of using NPV or ROI thresholds to determine which R&D projects make the cut is that early-stage research projects – for which NPV and ROI are impossible to calculate – will be disadvantaged relative to late-stage development projects. This may or may not be a desirable outcome in a particular strategic scenario, but such a bias risks leaving the portfolio empty of potentially important research needed to fuel the next business growth phase.
The fundamental problem with using NPV and ROI measures for R&D evaluation is twofold: First, they attempt to quantify into monetary units outcomes that cannot yet be so quantified; Second, they intentionally collapse the time and money dimensions into a single measure (respectively time-discounted dollars or percentage return) intended to also reflect the time value of money.
While “What is the NPV or ROI?” is the wrong question to ask for an R&D project, the intent behind the question is entirely legitimate, which is to gauge whether the R&D will add real value to the business. A better question is therefore how the R&D will impact key areas of the business. Reframing the conversation to be about the expected Business Impact, which is the contribution of R&D to important business outcomes, will facilitate more productive discussions between the CTO, the CEO and other executives, and the Board.
The goal of R&D portfolio management is to ensure that limited financial and human resources are deployed in service of the corporate strategy. The composition of the R&D portfolio is the ultimate responsibility of the CTO while the corporate strategy is the responsibility of the CEO, acting in concert with the Board. Considering the potential Business Impact of any R&D project or project proposal creates a built-in mechanism to align the R&D portfolio with the corporate strategy, and by implication to adjust the R&D portfolio as needed when the corporate strategy changes.
Constructing a 3D-Portfolio of R&D Projects
There are at least three major dimensions according to which each project in the R&D portfolio should be classified. I call this creating a 3D-Portfolio of R&D Projects. The three essential dimensions are
the type or area of Business Impact;
the relativemagnitude of the expected Business Impact;
and the approximate time horizon over which this impact is expected to happen.
Other dimensions or considerations may be added, such as the type of technology (technology family or generation), the level of maturity of the technology (though this will be highly correlated with the time horizon in most cases), or the extent to which an R&D project departs from current technology (incremental or radical change).
A sound R&D portfolio-management process will require making design decisions about each of these three dimensions, and then designing the process flows by means of which projects will be added to or removed from the portfolio. Typically, there will need to be a cyclical process (such as the annual budget cycle) and an exception-based process for when portfolio adjustments need to be made inflight.
The sections that follow provide guidance on designing the three dimensions, followed by a very brief discussion of designing the supporting portfolio management processes, as such processes will always be highly specific to any company or organization.
Step 1: Defining Your Set of Business Impact Areas
What is a suitable Business Impact to associate with an R&D project? A Business Impact must be more specific than “increasing revenue” or “lowering costs” or “making operations more sustainable.” However, it is the highest-level answer as to how specifically R&D can contribute to such top-level corporate goals. As such, each Business Impact is a vital link connecting desired R&D outcomes to corporate strategic goals.
Business Impact areas can be divided into three categories: those that are revenue-related, those that are cost-related, and a third category covering other areas such as sustainability-, safety-, or regulatory-related Business Impacts. It is advisable to employ a set of Business Impacts that includes at least one selected from each of these three categories.
While business objectives are best phrased at a high level, they also require sufficient specificity. This suggests looking to typical industry metrics or key performance indicators (KPIs) for inspiration. For example, a retail store chain may have the revenue goal “to increase sales per square foot” rather than simply to increase total revenue. An automotive OEM may have the cost-related goal of reducing “warranty cost per vehicle.” A chemicals company may have a KPI related to regulatory or environmental compliance, specified in terms of minimizing the “number of regulatory violations”.
Each industry has such KPIs with which everyone will be familiar. Table 1 contains examples for typical industries but is far from exhaustive. It is best to select about four or five such Business Impact areas in total for classifying your company’s R&D projects. If these have already been spelled out in a Board directive to the executive you are lucky, but absent that it is usually not hard to pick an uncontroversial set of business outcomes that R&D can impact and which few would disagree with.
The beauty of being able to classify each R&D project by the Business Impact dimension is that it makes it easy to answer questions from the Board such as “How much of our $50 million R&D spending is going to greenhouse gas (GHG) reduction?” In this example, if GHG reduction were one of your Business Impact areas (as it should be if it’s important for your company and in your industry), you would have the subtotal of R&D spending on that Business Impact readily available.
When the corporate strategy then needs to be adjusted due to say economic headwinds, the conversation can be about how to shift the balance of the R&D portfolio between Business Impacts. For example, the current R&D portfolio may be 30 percent allocated to a cost-related KPI such as “overhead ratio” in financial services. If a banking crisis causes the Board to demand a greater emphasis on such projects, it would mean shifting the balance to say 50 percent of the total R&D portfolio. Such a change may be achieved by increasing the number of projects related to that impact area, or reducing other projects, or by a combination of both actions.
Table 1. Examples of Industry KPIs Associated with Business Impact (Illustrative, Not Exhaustive)
Industry
Revenue-related (topline)
Cost-related(bottom line)
Other metrics
Automotive
Market share
Warranty cost
Fuel efficiency; platform commonality
Chemicals
Plant utilization
Energy usage per production unit
Number of regulatory violations; environmental compliance
Consumer packaged goods
Average consumer spending (on company products)
Supply chain efficiency
Brand loyalty; percent of ethically sourced products
Financial services
Assets under management
Overhead ratio
Risk-weighted assets; Basel III ratios
Manufacturing
Capacity utilization rate
Scrap rate
Backorder rate; changeover time
Metals & mining
Production volume
Cost per ton
Water quality index; safety
Oil & gas
Break-even oil price
Lifting costs
Exploration success rate; carbon intensity
Pharmaceuticals
Percentage of revenue from blockbuster drugs
Cost per new drug development
Pipeline strength; number of clinical trial failures
Retail
Sales per square foot
Cost per square foot
Average discount depth; customer satisfaction score (CSAT)
Technology
License and subscription renewal rates
Cost per line of code
Platform uptime; data breach incidents
Step 2: Defining the Range Scale for Each Business Impact
How do you prioritize R&D proposals that are tied to different Business Impact areas? Moving away from a single metric such as NPV or ROI to compare a R&D project’s value-add to multiple Business Impacts means that you have to find a way of comparing apples with oranges. However, this is not as hard to do as it may seem but it does require a shift in mindset:
The common scale of comparison for all Business Impacts becomes an ordinal scale with three to four intuitive impact descriptions on it, such as Low, Moderate, High, and Very High. The design work is in defining what each impact description means for each Business Impact area. For example, if the Business Impact is reflected by a KPI that can typically only be moved in single digit percentages, it would look like the “Business Impact 1 KPI” in Table 2, where a “High” impact is classified as a 5 to 10 percent increase. Another Business Impact may be easier to inflect, such as “Business Impact 2 KPI”, and therefore may need to be improved by 20 to 30 percent for it to be considered a “High” impact.
Completing such a table for each Business Impact area versus the ordinal scale for the impact (e.g., low to very high) will result in an impact “rubric” which can be used to compare the potential relative benefit or value-add for R&D projects that are entirely different in kind, for example, an increase in market share versus engine fuel efficiency for an automobile OEM.
Table 2. Illustrative Rubric for Comparing Business Impact
Business Impact 1 KPI
Business Impact 2 KPI
Low
< 1%
< 10%
Moderate
1 to 5%
10 to 20%
High
5 to 10%
20 to 30%
Very high
> 10%
> 30%
Before launching the new rubric to grade the first R&D project proposals, the CTO’s team must take great care in calibrating the scales with the involvement of the entire R&D leadership and key stakeholders in other departments. That will create trust and prevent anyone from gaming the system to advance their pet projects.
It is also important to be fair and maintain the integrity of the grading for each R&D project by using peer review to check the claimed magnitude of the Business Impact KPI movement for each case under consideration. This is best done in an R&D budget decision meeting with all the major parties present.
Step 3: Defining the Time Horizons to Use
A multi-year classification framework is needed to indicate the approximate timeframe in which an R&D project’s Business Impact is expected to be achieved. The simplest and most intuitive approach is to use the Three Horizons, where Horizon 1 (H1) is the short term, Horizon 2 (H2) is the medium term, and Horizon 3 (H3) is the long term. For illustrative purposes, H1 is typically 12 to 18 months, H2 is 18 months to 3 or 4 years, and H3 is farther out. However, the durations will differ by industry as industries have shorter or longer cycle times. You’ll need to define the Time Horizons that make sense for your industry and apply them consistently.
The Time Horizons will facilitate the cross-referencing of the 3D R&D portfolio with your company’s Technology Strategy. For example, where your strategy is to only implement fairly mature technologies in a particular technology domain, that may result in only selecting R&D projects in that domain that fall within H1. On the other hand, if you see yourself as a technology leader in your industry for a particular domain, that would argue for having R&D projects all the way out into H3.
Creating the 3D-Portfolio of R&D Projects
By far the best way to have a portfolio of R&D projects that can each be tied to Business Impact is to create it that way from the start. This can be done by employing the portfolio framework described above.
Rather than simply inviting and collecting R&D proposals or ideas – as is often the case during the annual proposal cycle – you must give guidance on what types of proposals are desired and how they will be evaluated. You should map out the portfolio composition you want to end up with by constructing a table indicating desired allocations (percentages or dollars) by Business Impact versus Time Horizon. This guidance should be compiled ahead of the proposal invitation period by the CTO’s team in consultation with key business partners and with reference to the corporate strategic objectives for the year.
Following this process will effectively cascade the corporate strategic goals down to high-level R&D departmental goals and shape the resulting new R&D portfolio. [I previously described the complete hierarchy of innovation value-creation levels versus the parts of the organization responsible for each step in Chapter 7 of my book, Innovation for Value and Mission – An Introduction to Innovation Management and Policy.]
Once you have defined your 3D framework, you can use it to retroactively classify and organize all existing R&D projects. This may be necessary in case of a mid-cycle event such as receiving a new strategic directive from the Board or CEO that necessitates a rebalancing of the R&D portfolio. Having an R&D portfolio classified by the three dimensions will facilitate the most rational and unbiased way of making portfolio changes, even if there has to be cuts. And it will minimize the likelihood of making cuts that you’ll deeply regret later!
This article was originally posted by the author on LinkedIn.
Thank you for a great conversation, Rex Wallace, Mick Twomey and Nate Lucena!
There is indeed a real opportunity to improve Star Ratings with innovation. Special thanks to all the Star managers who participated in my research and to the Medicare Advantage experts who helped me better understand the context in which managers make decisions.